
Visualize This (2nd ed.)
How to make great charts, step-by-step.
Use tools with real examples.
Design visualization with purpose.
Apply to your data.
Visualize This is a guide for those who want to make charts. Walk through concrete examples, based on my own projects, to learn the full process from dataset to finished graphics. Try different tools. Experiment with visual forms. Visualize your own datasets.
Nice Things Others Say
“Nathan has been a permanent presence in the field since I started out and this book perfectly distills those years of experience, exposure, skill, and practice he’s put in to supporting and celebrating this field.”
“Reading Visualize This felt and still feels like sitting next to an experienced designer while he works at his computer and shares dozens of tips and tricks. It’s a great feeling indeed.”
“It's a fantastic updated how to guide. Really recommend.”
“Happy you made a second.”
Data First
There’s a template-like approach to visualization that says you can plug a dataset into software, make a series of mechanical decisions based on data type, and get great charts. Some say to let the data speak for itself. This almost never works how you want it to.
You might not know what you’re looking for in the data. There are many chart types and visual forms to choose from, even after narrowing down the selection. The design of the chart should shift based on what you want to show, which is driven by purpose and audience.
So Visualize This starts with the data. Ask questions about the data. Learn about the data. Then make worthwhile charts.
Building a Toolset
We like to obsess over what tool is best. What programming language? What charting suite? What visualization method? What software?
Go with the tool that is best for your situation.
This might mean that you use a variety of tools, or it could mean that you find one tool to do it all. I use a mix of R, Python, Illustrator, and web development tools, which works best for me, but other practitioners might use a different combination that works best for them.
Visualize This introduces you to a mixed set of tools. Step-by-step examples help you get a feel for how they work, so you can decide what’s best for you.
Table of Contents
Start with the data and walk through the process of turning it into finished graphics:
- Telling Stories with Data
- Choosing Tools to Visualize Data
- Handling Data
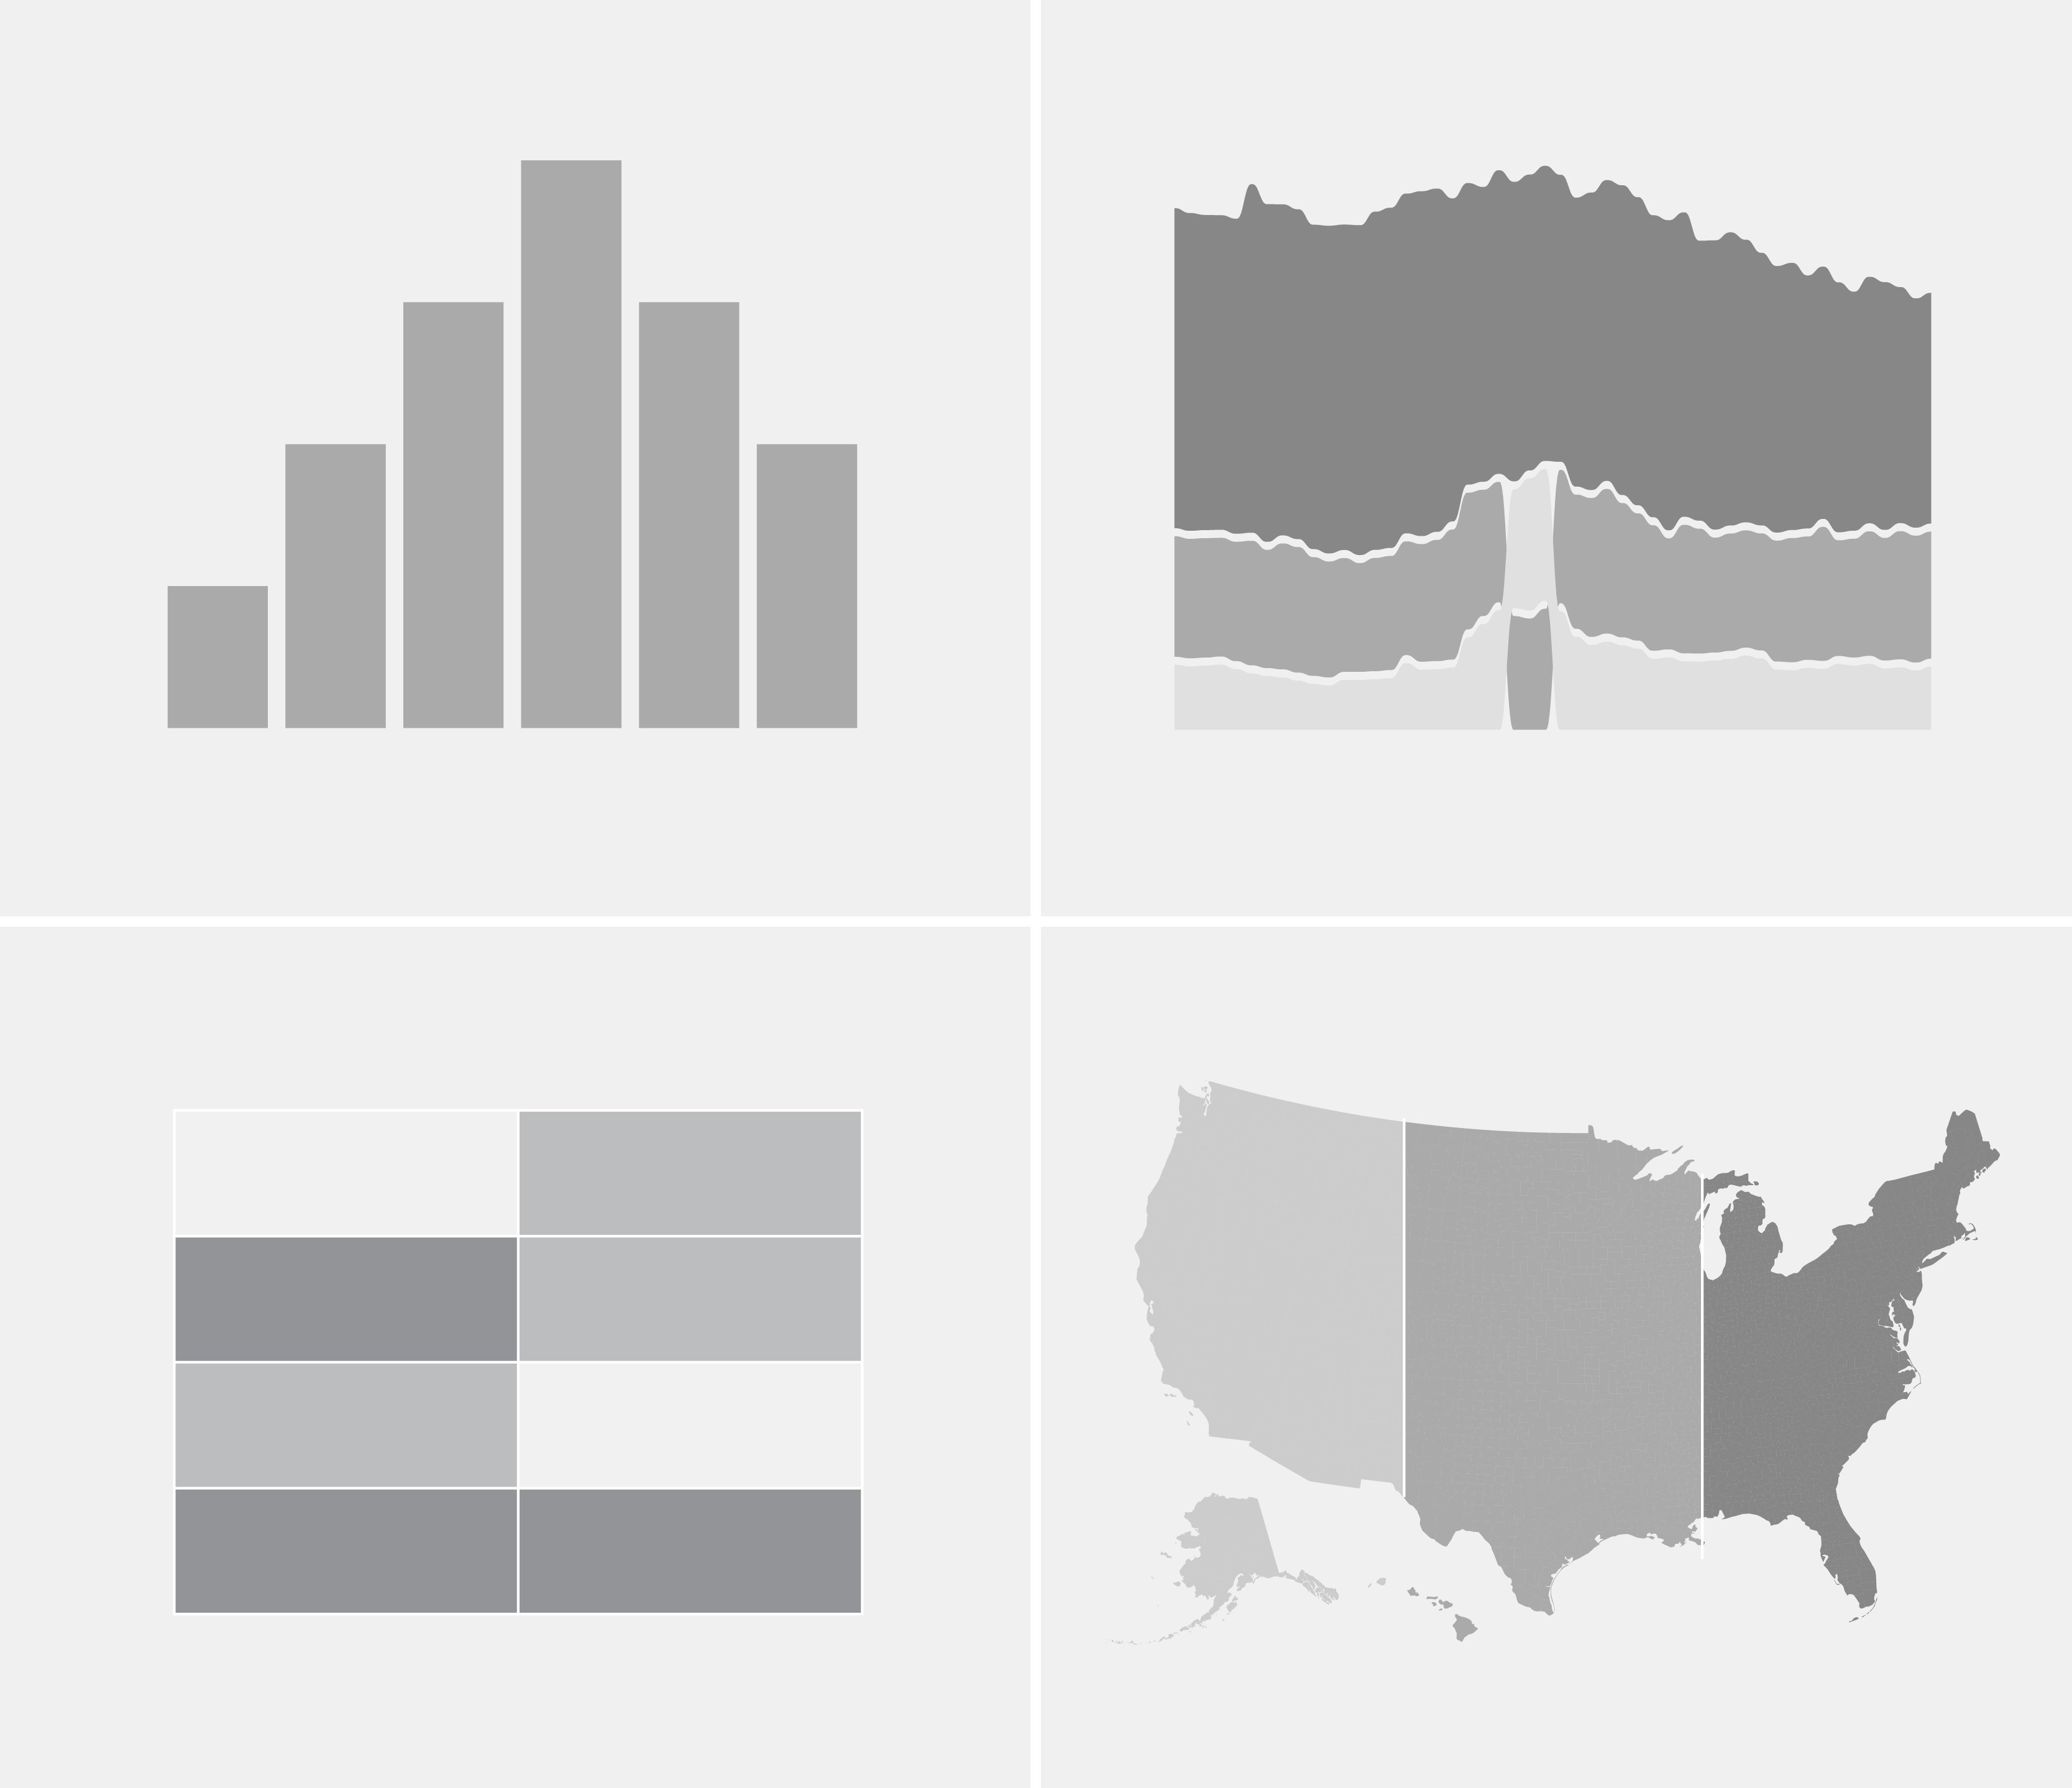
- Visualizing Time
- Visualizing Categories
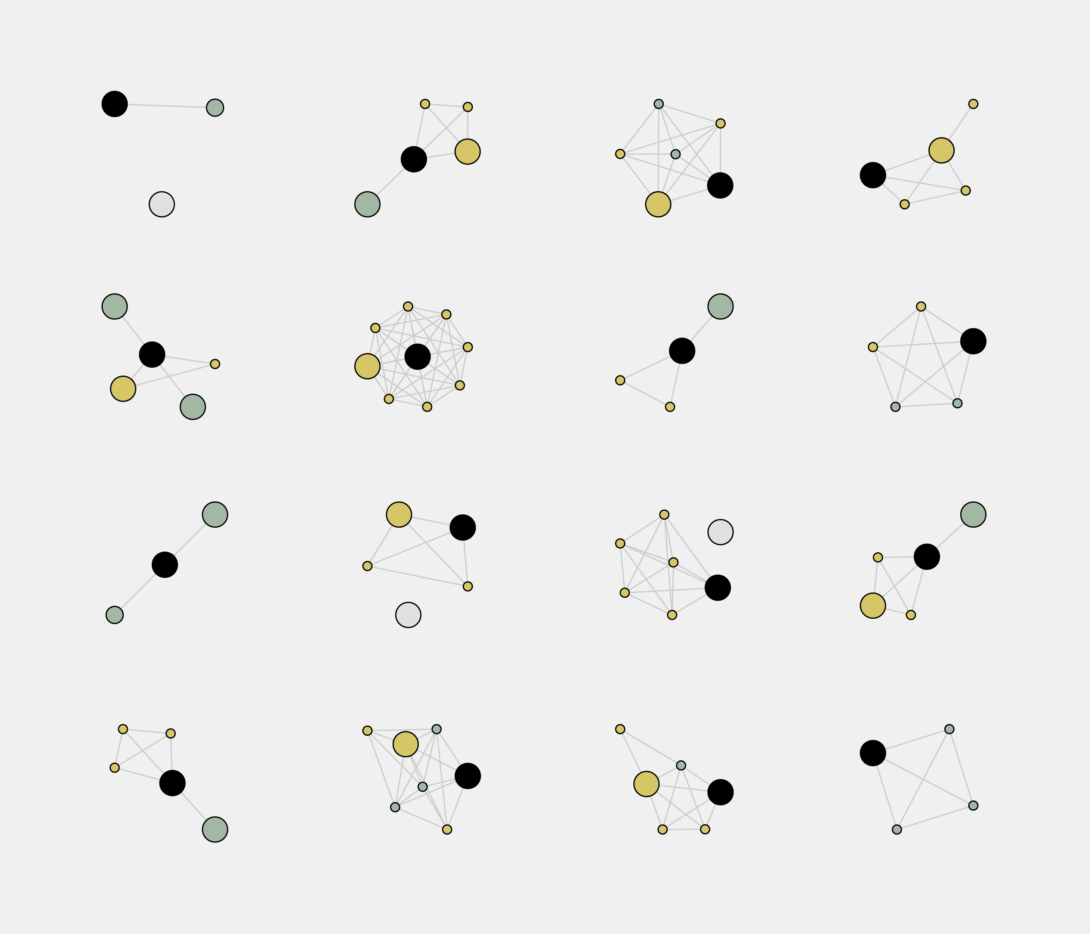
- Visualizing Relationships
- Visualizing Space
- Analyzing Data Visually
- Designing with Purpose
Second Edition
The first edition of Visualize This was released in 2011. Over the past decade, visualization matured, tools came and went, and data grew more universal. I also analyzed more data and made many more charts. This second edition of Visualize This introduces new tools, datasets, methods, resources, and examples.

About Nathan Yau
Hi, I’m Nathan. I have a PhD in Statistics, with a focus on visualization for presenting data to non-professionals. I’ve been analyzing and visualizing data for FlowingData since 2007. I was a winner of a FastCompany Innovation by Design Award for Graphic Design & Data Visualization; I’ve won Information is Beautiful awards; and I was featured in The Best American Infographics. I’ve worked as a researcher and for mainstream publications. My work leans towards practical but has also reached millions of people.